

AI + Web
I turn ideas into experiences.
WEB, DESIGN & AI DEVELOPMENTOne place to see every client.
TotalRank is IDG Advertising's platform for managing a portfolio of client accounts. It brings leads, calls, paid media, SEO, AI visibility, social and site health data into one place. It scores every lead for quality, shows each lead's journey, watches every account for problems and opportunities, and turns each finding into a task the team can own and track. Clients log in to their own dashboard and see the same reporting the team uses, so everyone works from one set of numbers.
- of reporting time saved every month
- 1–2 wks
- client accounts monitored in one view
- 44
- shared dashboard for the team and its clients
- 1
- platform replacing Monday for task management
- 1
TotalRank: Turning Scattered Client Data Into Clear Next Steps
- COMPANY
- IDG Advertising
- PRODUCT
- Internal agency platform
- ROLE
- Developer
The problem
To check on one client, an account manager had to open the ad platform, analytics, the rank tracker, the site crawler, call tracking and the lead inbox. Monthly reporting meant repeating that for every account by hand. Problems often came to light late, sometimes only after a client asked about them. Leads were the hardest part. Calls and form fills lived in different places. Lead counts said nothing about quality, and once a lead came in, nobody could easily see what happened to it next. Even when the team spotted a problem, the follow-up lived in Monday, a separate tool with none of the data behind the issue. The team needed quick answers to five questions:
- Which clients need attention right now?
- Are we bringing in good leads, or just more leads?
- What's actually wrong?
- What should we do about it?
- Who owns it, and is it getting done?
Centralize.
Every client gets a card with the same five signals: leads, cost per lead, sessions, top-10 keywords and AI visibility, each compared to the prior period. A 0 to 100 health score sums up the account. The team can switch between 7-, 30- and 90-day windows and filter by discipline (SEO, Paid Media, Lead Ops, AI, Social, Web, Yelp), so each specialist can go straight to their own work.
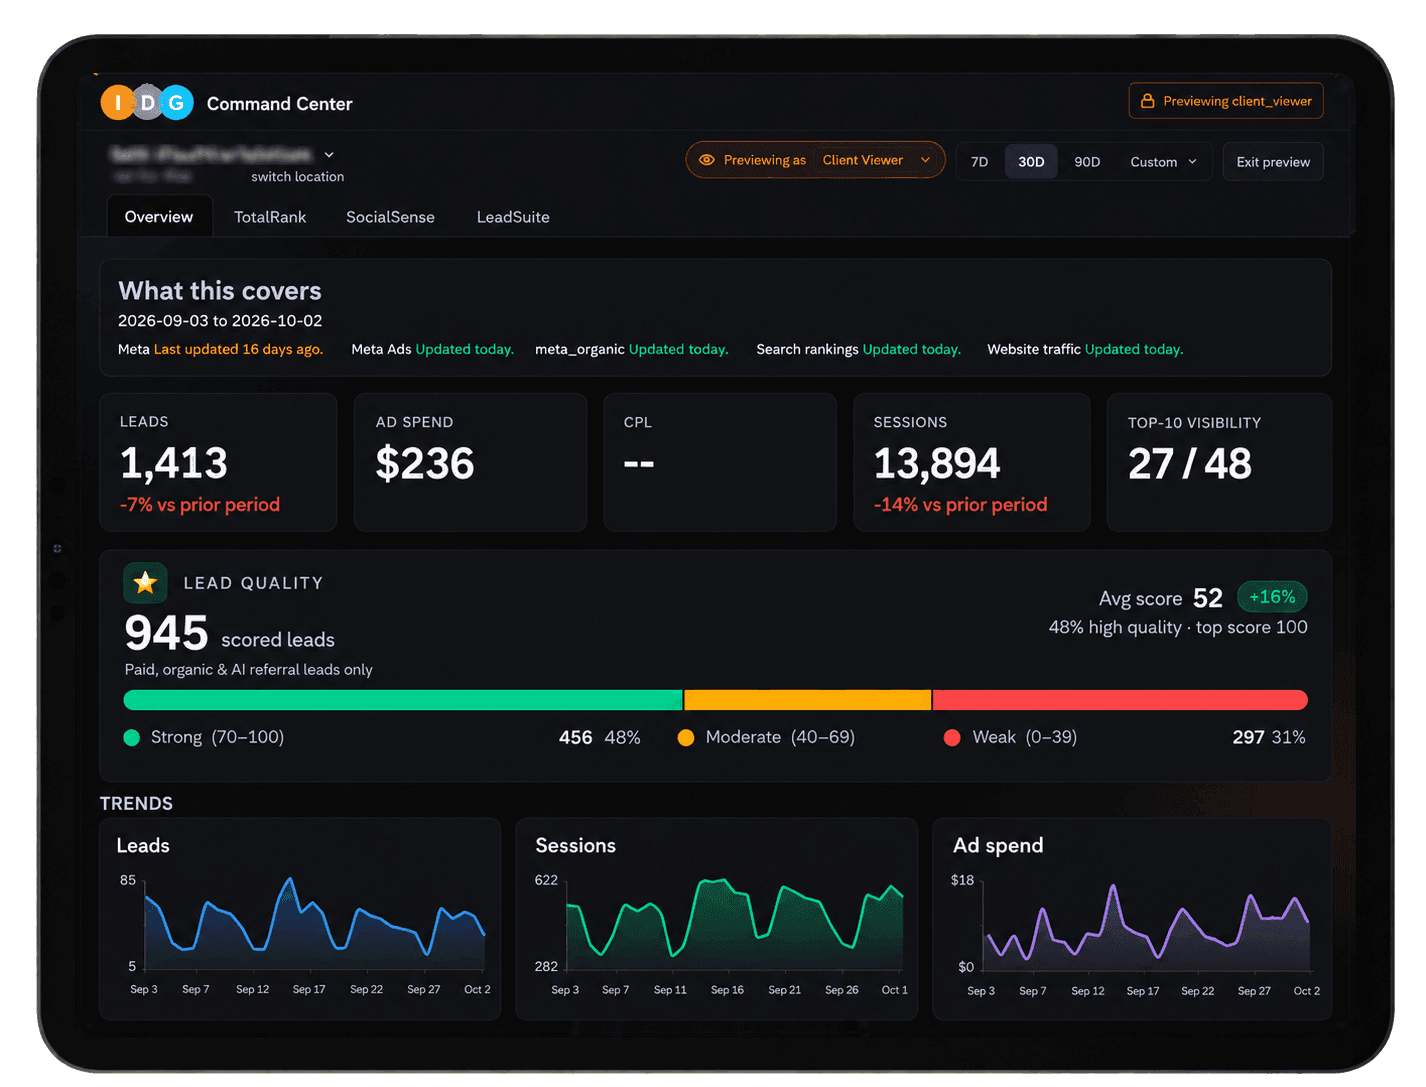
Clients log in to see their own performance: leads, lead quality scores, the lead pipeline and trends over time. It runs on the same data the team uses to manage the account, so numbers no longer get copied out of five tools into a monthly deck. Reporting is always up to date, and conversations about what's working, and what isn't, are faster and easier to trust.
Leads.
Calls and forms together. Calls come in from CallRail and form fills from the client's site, all in one lead inbox. With both channels tracked side by side, TotalRank catches problems that a combined total would hide. For example, "Call leads stopped, forms still active" points to broken call tracking, not a drop in demand.
Every lead gets a 0 to 100 quality score. Leads scoring 70 or higher count as high quality. The team tracks what share of each client's leads are high quality, so a month with fewer but better leads reads as a win, not a loss. A drop in quality gets flagged the same way a drop in volume does.
Pipeline. Act.
The pipeline shows each lead's journey, from first call or form fill through to the outcome. Clients see the pipeline in their own dashboard, so conversations shift from "how many leads did we get?" to "which leads turned into business, and where are the rest getting stuck?"
The Action Center is where alerts become decisions. Each flagged client gets a card listing every active issue, with actions right on the card: open the lead inbox, draft a brief, or snooze an alert for 24 hours or 7 days. Optimization opportunities show up in the same place, so improvements get the same follow-through as fixes. A Today view puts everything that needs someone in order, most urgent first: blocked, overdue, unowned, waiting on a decision, or recently changed.
A keyword drop becomes a research question with a confidence score. The team accepts it, dismisses it or asks for more evidence. Accepted work goes onto a worklog and is tracked from proposed to applied to measured.
Work.
Flagging a problem only helps if someone owns the fix. Right now, an alert in TotalRank has to be copied into Monday by hand before anyone can act on it. We're building a productivity platform inside TotalRank to replace Monday, so alerts and client work become tasks in the same place as the data behind them.
An issue in the Action Center can be turned into a task tied to the client, the project and the alert that started it. The context stays with the task, so nobody has to re-explain why it matters or switch tools to find it.
Unclaimed tasks sit in a shared "Nobody has taken these" queue with a one-click Claim this button, so nothing quietly falls through.
Each person's Home shows what's waiting on them: blocked work, overdue items and pending approvals. When it's clear, it says so.
An activity feed shows who picked up, handed off or resolved what. A "Who is on what" view shows each teammate's open work, so it's easy to see who has room for the next task.
Seven data sources, one health score
Calls come in from CallRail and form fills from the client's site, all in one lead inbox.
3. Monitor: Alerts That Explain Themselves
- Every account is sorted into one of three tiers: Needs attention, Watch or Healthy. Each alert is a specific, plain-language finding:
- "Top-10 keywords down 75% this period"
- "High-quality leads down 24 points (53% scoring 70+)"
- "No leads for 40h of active time, 20× longer than usual"
- "80 crawl errors detected on site"
- Lead gaps are compared to each client's own normal pace, so an alert means the same thing for a small local business as it does for a high-volume brand.
Reading signals together
- When several signals move together, the platform reads them as one story and suggests a likely cause.
- If traffic is steady but leads are falling, it points to a conversion problem: forms, landing pages or call tracking.
- If rankings, traffic and leads are all falling while paid holds steady, it points upstream to organic search.
- The team gets a starting point, not just an alarm.
When every alert is urgent, none are.
A triage plan for engineering.
After launch, alert volume became its own problem: 146 signals in one week, across 44 accounts. When everything is flagged, people stop reading the flags. I audited the alert system and wrote a triage plan for engineering:
- Make alerts meet a bar. Add minimum volume floors and require a problem to last before it fires, so a tiny sample can't set off a triple-digit alert.
- Group related alerts into one card with one root cause.
- Give each category a default owner, so alerts go to the right specialist.
- Move wins to their own feed, so the Action Center only holds decisions.
- Treat repeat snoozes as a signal that a threshold needs tuning.
- Send the Watch tier as a digest instead of a steady drip.
- Link every alert to its evidence, so "10 keywords fell off page 1" opens those 10 keywords.
The clearest win so far is time. The data lives in one place and clients have their own dashboard, which saves the team 1 to 2 weeks of reporting work every month. That time now goes to the client work the alerts point to. Lead quality scoring and the shared pipeline give clients a clearer view of what their marketing actually produces. Once the task platform launches, it will replace Monday, removing a separate subscription and the manual step of copying alerts into another tool. The platform measures the results of each fix after it's done, so client outcomes will build up over the coming months.
Putting the data in one place was the easy part. The harder design work was deciding what deserves attention, explaining why in plain language, and making sure every alert ends up with an owner. TotalRank gives the agency and its clients one shared view of performance, and takes the team from spotting a problem to fixing it in one platform.
IDG Advertising's new site
Rebuilding our own agency site with AI-assisted tools, organized around one idea: getting found.
MY ROLE · Designer & Developer